Connectivity
Contents
Connectivity

Connectivity performance in micro-mobility is defined by the effects of reducing the negative externalities of traffic congestion, and in creating nodal networks of mobility by inter-linking existing commuting services. In the urban commuting ecosystem, the objectives of bike-shares are reducing vehicle congestion and parking demand for short and medium-distance trips.
Micro-mobility: sustainable for the climate?
The promise of micro-mobility services is to present an alternative to motorized transportation, contributing to the cumulative offset of emissions. However, a study conducted in Switzerland suggests that "personal e-scooters and e-bikes emit less CO2 than the transport modes they replace, while shared e-scooters and e-bikes emit more CO2 than the transport modes they replace". Bike-shares therefore lose in sustainability if the distance being covered substitutes less for distances covered by cars, and moreso for trips qualified as 'walking distance' (< 1 Km). Therefore, if micro-mobility bike-share is to have a substantial impact on urban emissions, it needs to fill a travelling niche equivalent to medium-driving distance.
Measuring Connectivity:
What is the distribution of bike-share trips by walking and driving distance?
How does bike-share link-up with existing public transportation nodes?
What is the share of bike-share trips that could be qualified as ‘first’ and ‘last’ mile commute?
Data Overview
Over the course of three full-years of operations, San Franciscans have riden nearly 2 Km (1.24 mi) on average. Thus, the overall tendency of bike-share riding in the city is not to substitute for trips within 'walking distance' (< 1Km). Furthermore, since 35% of all car trips in the U.S. are under 3.22 Km (2 mi), bike-share commute fills a traveling niche for trips too long for walking yet possibly costly and inneficient for driving.
We observe that the distribution of riding distance is slighly positively skewed, since the mean is greater than the median, in part due to the large number of short-distance trips.

This beg the question: what variables are affecting distance in the dataset?
The most self-evident factor is the difference between bike type, i.e. electric bikes and non-electric bikes. If we look at distance between these categories, the difference in riding distance becomes discernable:
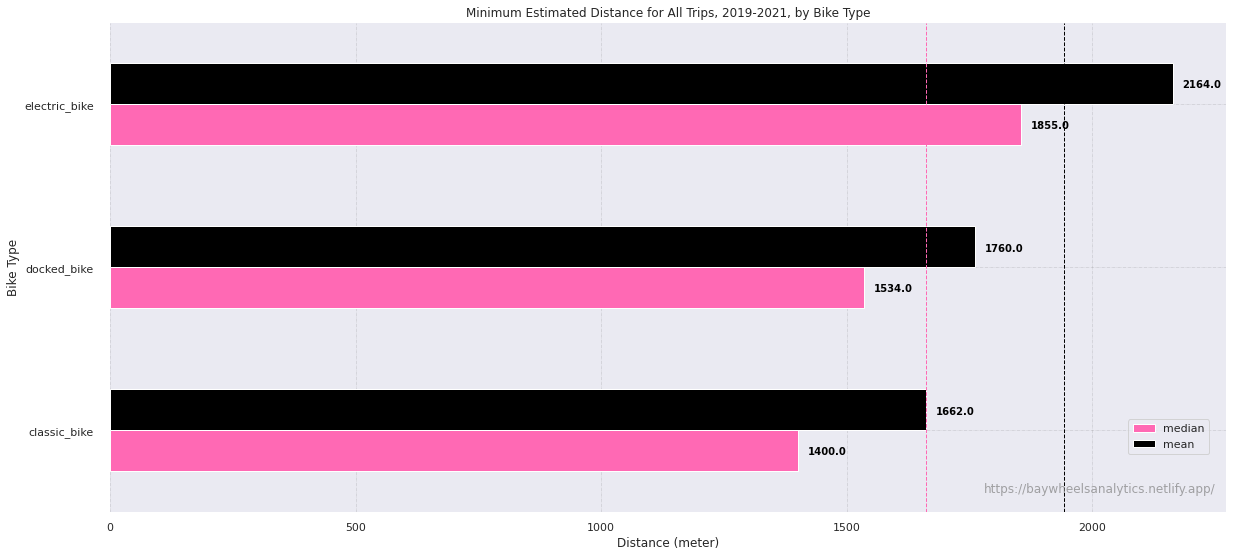
Unsurprisingly, electric bikes lead the average and median distance covered (both outpace respectively the mean and median of the entire dataset). For our purposes, we are assuming that 'docked bikes' and 'classic bikes' are both the non-electric bikes, 'classic bike' being a categorical label which was introduced at a latter stage in Bay Wheels' data collection process (without metadata to verify this claim, I'm making an informed assumptions based on my experience wrangling the raw dataset). The main observation is that e-bike riders cover 20% more travel distance on average (this is true for median distance as well) compared to the distance covered by non-ebike riders (averaging the mean distance of 'classic' and 'docked' bikes).
If we compare distance as a factor of trip type, we observe that dockless rides, whether at the pick-up or drop-off points or both, tend to cover longer distances compared to the overall mean average. The reason for this is likely two-folds: 1) all dockless rides involve e-bikes (these are the only bikes that have a build-in lock), and as we know, e-bikes cover more distance on average than non e-bikes; & 2) dockless trips offer a wider coverage of areas that can be travelled in the absence of docking stations. Meaning: a trip is likely to increase in distance in areas where docking stations are either absent or present in low-density.

Apropos the data
Although the raw datasets provide the location of the start- and end-point of each trip, with timestamps to measure the duration of rides, it does not provide a measure of the distance covered. What I did therefore, for the main dataset of 5M+ datapoints, was to simply calculate Euclidean Distance between each point. This serves a useful purpose to establish the minimal distance between two locations, however, as you all know, people can not move like birds, and get to their destination in a linear fashion.
Henceforth, a workaround solution: using Google’s Distance Matrix API, we can have an estimate of the Network Distance, i.e. the shortest path distance between two points following a path, like a road. Furthermore, Google’s API provides an option to estimate the optimal Network Distance for bicycle rides. Now, this also poses a normative conandrum: people don’t necessarily ‘optimize’ their routes between A and B, and even if they do, traffic and the entropy of sharing the road does not always yield an optimal trip by distance and time. But it’s the best option that we have with our current limitations, and offers much better real-world accuracy compared to Euclidean Distance.
However, a snaffu is that Google’s Distance Matrix API is a paid service (which can be offset thanks to Google Cloud’s free trial offer; yet, even with $300 worth of credit, running the API through 5M+ datapoints will do me no good. Statistics is the art of frugality, therefore I had to be selective in choosing the sample of trips I wanted distance estimates for.
Another hiccup is the limitation of the spatial resolution innate in the dataset. Now, datapoints starting and ending at docked stations have a high degree of spatial resolution, however, dockless trips, understandably out of the ethical necessity to maintain the privacy of its users, yield a much lower spatial resolution (up to only two or three decimal places on each start- and end-point’s geographic coordinates). Additionally, these points are laid-out in a grid-like fashion, to further anonymise the directionality and density of those trips. But this level of accuracy is good enough to aggregate these trips by neighborhoods and census tracts. However, running Google’s API on dockless trips will yield a less accurate estimate of distance compared to docked trips.
And I’m afraid we’re not quite done yet: you see, some trips start and end at the same location! These are what I call ‘looped’ trips. For dockless trips, this is possibly a post-processing artifact from rounding-up coordinates. For docked trips however, and I was quite surprised to observe this in the dataset, ‘looped’ trips, which start and end at the same pick-up/drop-off station, are quite popular! The good news is that I can make certain inferences about ridership behavior by location and time (for example, ‘looped trips’ in touristy areas might serve as a choice alternative to rental bikes). The bad news is…we can’t estimate accurately for a distance…What I can do if I so choose instead is to interpolate by taking the average of meter distance covered by seconds, for example, and apply it to the time elapsed for those trips. But that’s beside what we’re trying to accomplish for this particular KPI.
As you understand, we are required to be strategic about getting the most out of the dataset, and be deliberate on how to select representative samples over different data dimensionalities.